What a Typed-Decision Leaderboard Can—and Cannot—Tell You About AI Judges
Darwin-27B-ZTC-v2 leads a benchmark for typed, single-pass decisions. Here is how to interpret that result, where rank aggregation helps, and what teams should test before adopting an AI judge.

Treat a typed-decision leaderboard as candidate-selection evidence, then validate class-specific risk, calibration, stability, and end-to-end cost on real traffic.
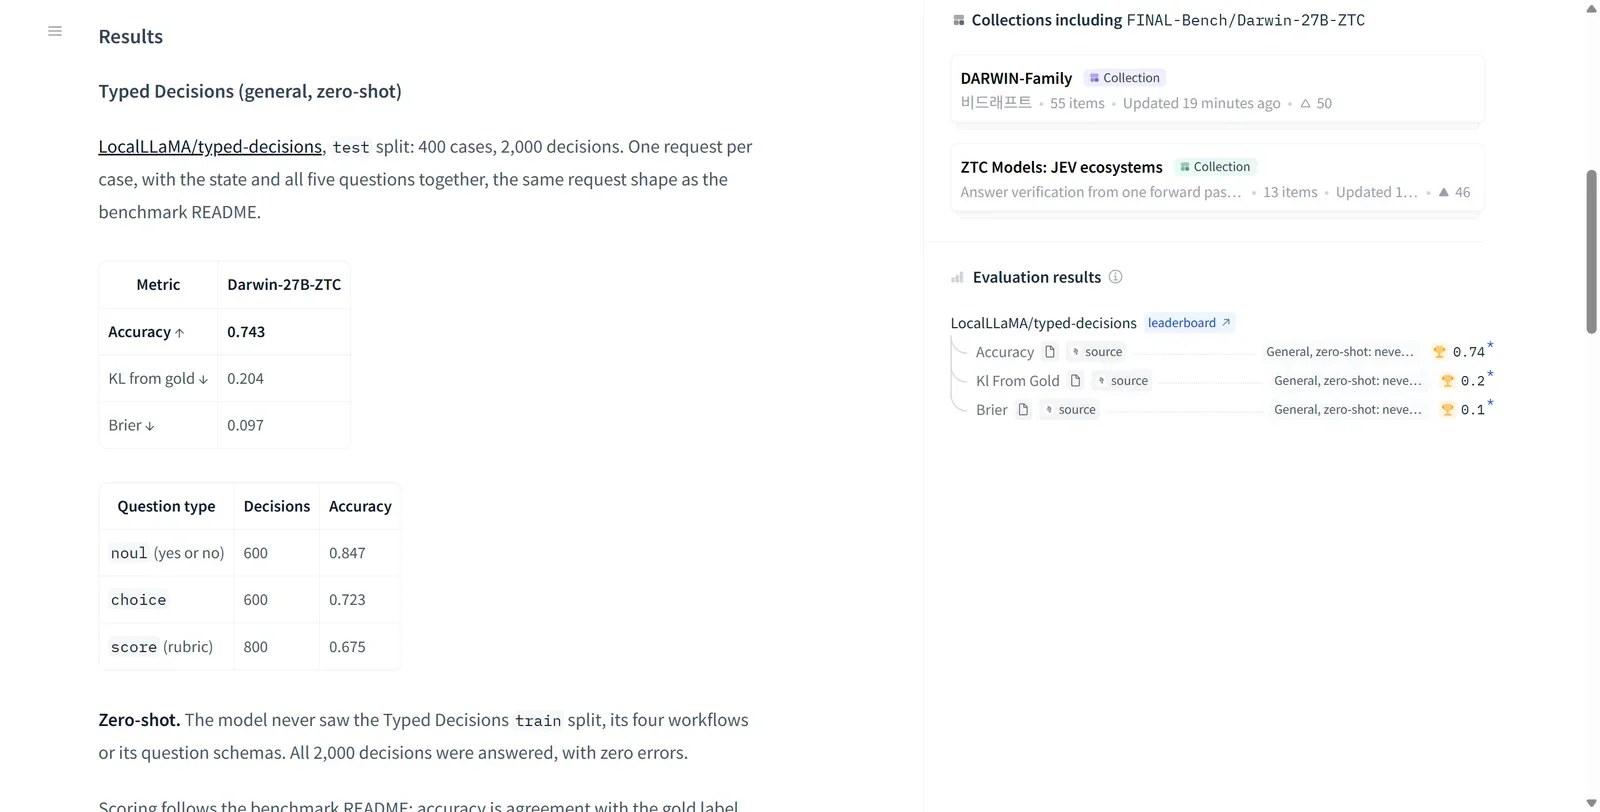
A model that chooses a label is solving a different operational problem from a model that writes an explanation. That distinction matters when an AI system needs a router, grader, policy gate, or confidence score rather than another paragraph of generated text. A newly reported benchmark result offers a useful occasion to examine how these typed-decision models should be evaluated—and how much weight a leaderboard should carry.
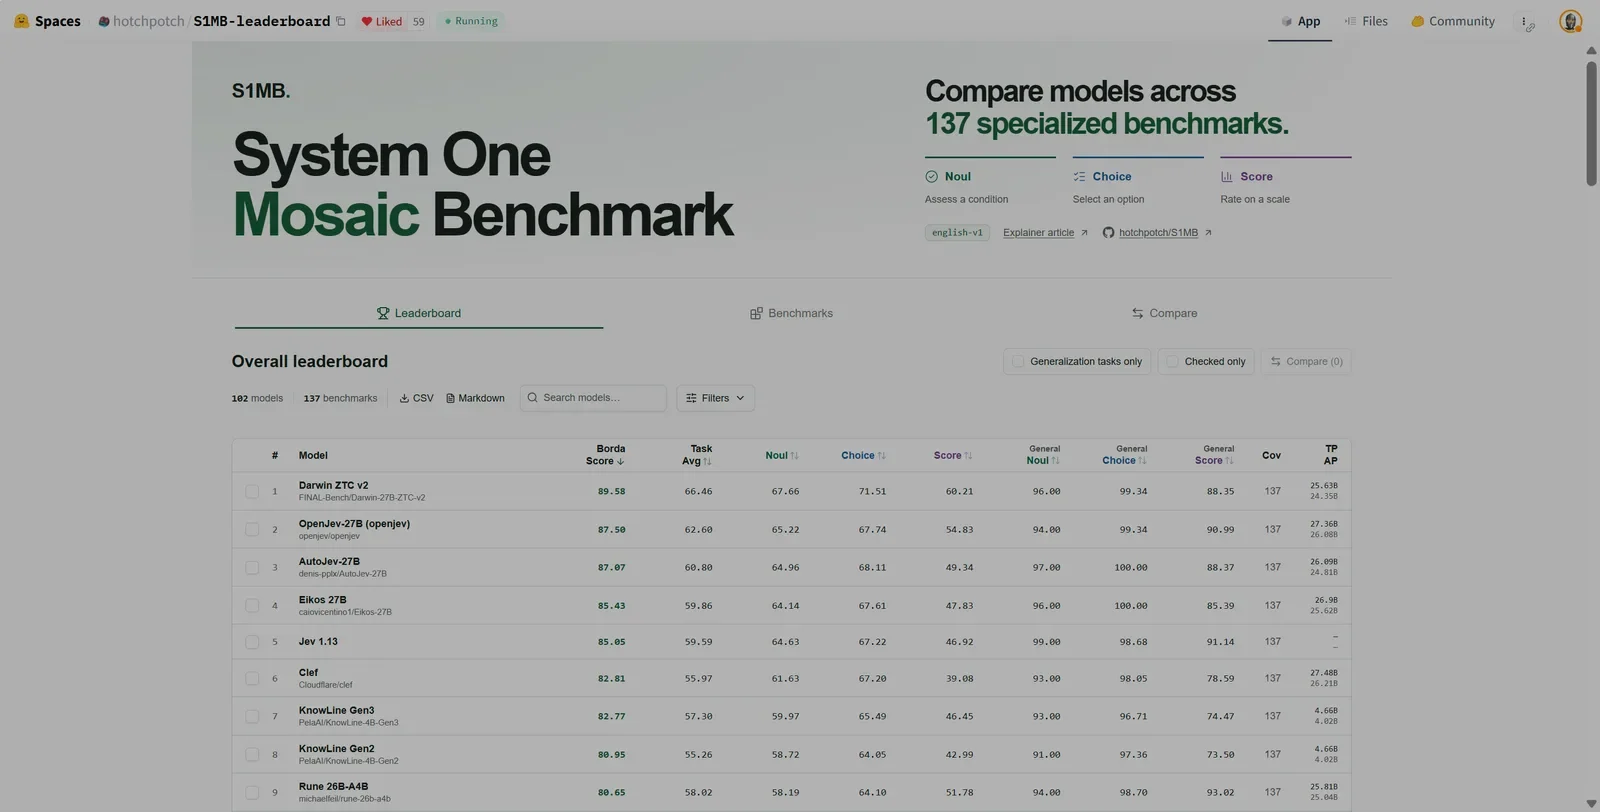
In an October 9 community article, FINAL-Bench reported that Darwin-27B-ZTC-v2 held the top position on the System One Mosaic Benchmark (S1MB) at the time of publication. S1MB combines 137 specialized benchmarks across three task families: assessing a statement, choosing among candidates, and assigning an ordinal score. The reported table gave Darwin a Borda score of 89.58 and a task average of 66.46. Its largest advantage over the second-ranked entry appeared in the scoring family, where it recorded 60.21 versus 54.83. These figures are a dated leaderboard snapshot, not a permanent rank.
Typed decisions change the evaluation target
A conventional language model is often judged on the text it produces. A typed-decision model instead maps an input to a constrained result such as allow, review, or block, ideally with probabilities. There is no requirement for a natural-language answer, and a deployment may intentionally avoid generating one.
That makes familiar generation metrics incomplete. Style, fluency, and answer length are largely irrelevant to a routing decision. The important questions become whether the selected class is correct, whether ordered ratings preserve their intended order, and whether a stated confidence of 80% behaves like 80% over many comparable cases.
The narrower output can be an advantage. It reduces format ambiguity and removes the need to parse prose back into a machine action. But it also removes context that might help an operator understand a surprising judgment. A production design therefore needs a separate observability path: preserve the input, decision, confidence, model version, and policy version even if the model itself emits no explanation.
Why aggregate ranks need a second view
S1MB uses Borda-style aggregation, converting performance on each component benchmark into rank-based points. This can reward broad consistency: a model that performs near the top across many tasks is less likely to be hidden by incompatible raw scales. It also limits the ability of one numerically large metric to dominate an overall average.
Rank aggregation has tradeoffs. It compresses the distance between competitors. A tiny raw-score difference can change a rank, while a large difference may earn the same rank advantage. The population matters too: adding or removing competitors can alter the points even when a model's underlying predictions do not change.
Read the Borda position together with the family-level results. For a multiple-choice router, the Choice result may be more relevant than the overall rank. For a quality grader assigning one through five stars, the Score family deserves more attention. The benchmark's aggregate answers “how broadly competitive is this model within this field?” It does not answer “will it satisfy this application's error budget?”
Turn a leaderboard result into a deployment test
Start by translating the application into a decision table. List every output class, the action it triggers, and the cost of each wrong transition. A false approval in a safety gate is not interchangeable with an unnecessary escalation to a human. Plain accuracy conceals that asymmetry.
Next, assemble an evaluation set from the intended traffic. Keep duplicates, near-duplicates, ambiguous cases, and rare but expensive failures visible as separate slices. If the model supplies probabilities, define thresholds on a held-out portion, then measure calibration and coverage on untouched data. A useful review curve shows how error rates change as low-confidence cases are handed to a person or a stronger model.
Test stability around decision boundaries as well. Small, meaning-preserving edits should not cause arbitrary class changes. Conversely, edits that alter the decisive fact should change the result. This paired-case method can expose brittle keyword dependence that an aggregate benchmark score misses.
Finally, measure the complete system. A single forward pass avoids autoregressive output decoding, but end-to-end latency still includes tokenization, batching, transport, and any fallback path. Cost comparisons should use the same hardware assumptions, batch sizes, input lengths, and service-level objective. The architecture suggests a potential efficiency benefit; the actual benefit is a deployment measurement.
Keep the scope of the claim narrow
S1MB targets typed judgment, not open-ended writing, tool use, or long-form reasoning. A leading result can support consideration of Darwin-27B-ZTC-v2 as a judge candidate, especially when ordinal scoring matters. It cannot establish that the model is the best choice for unrelated generation tasks, nor can public benchmark coverage prove robustness on private domain data.
The most useful interpretation is therefore conditional: the result is evidence of broad competitiveness on the benchmark's decision tasks as they stood on October 9, 2026. Adoption still depends on class-specific errors, calibration under distribution shift, operational cost, and a safe fallback policy. A leaderboard should determine what enters a careful trial—not what automatically enters production.
Source: Leading the System One Mosaic Benchmark: What Darwin-27B-ZTC-v2's #1 Means ↗. How we write