A Live Weather Leaderboard Turns Forecast Evaluation Into a Daily Practice
FINAL-Bench compares physics, AI, and fused weather forecasts against a common reference each day. Its public record is useful, but interpreting a winner requires attention to coverage, verification data, metrics, and independence.

A live, open forecast record improves accountability, but model choice should be based on the relevant variable, horizon, location, reference data, and decision metric—not one global rank.
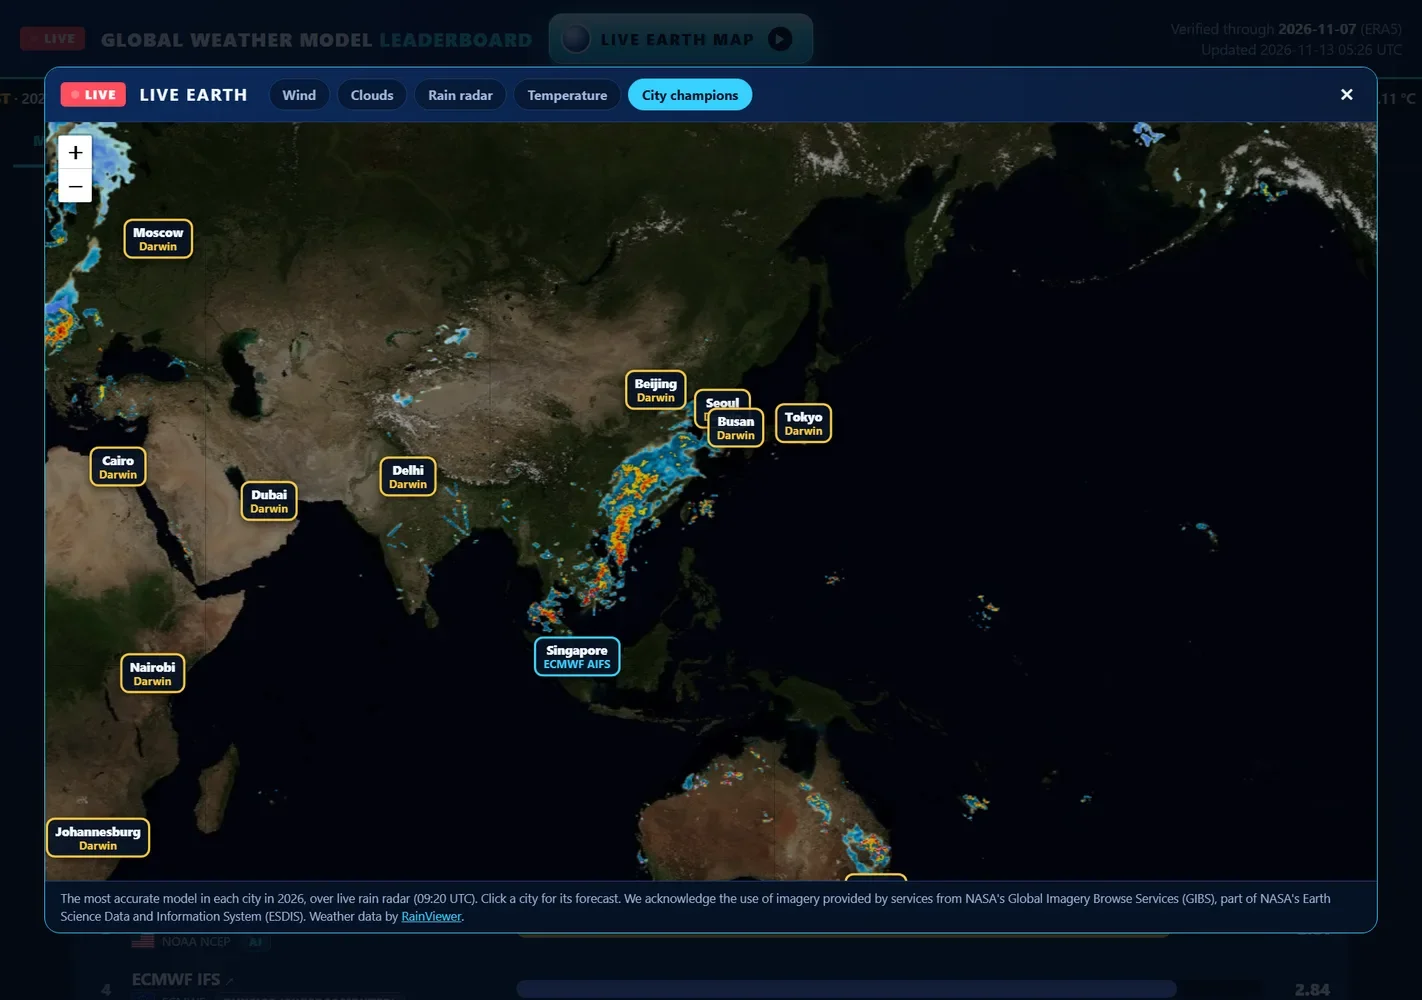
Weather-model comparisons often arrive as retrospective research: a fixed test period, a carefully selected set of variables, and results published well after the forecasts were useful. FINAL-Bench proposes a more operational view. Its Global Weather Model Leaderboard records forecasts for 24 cities on six continents, waits for the target day, and then scores those predictions against ERA5 reanalysis. The record begins on January 1, 2026 and is designed to update daily.
That format matters because a live benchmark asks a different question from a historical paper. It does not only ask whether a model performed well on a frozen dataset. It asks whether the model can continue producing forecasts, on schedule, under changing seasonal conditions. The leaderboard includes physics-based systems and newer AI systems from major forecasting organizations, alongside Darwin-Prediction-Weather, a fusion system made by the leaderboard's authors.
What the benchmark measures
The comparison covers daily maximum and minimum temperature, maximum wind speed, and precipitation total. Forecasts extend to ten days, while the reported ranking currently emphasizes lead times from one through seven days. Root-mean-square error, or RMSE, is the central score, so lower values are better. Cases are restricted to city-days for which every listed model produced a forecast, an important fairness rule that prevents one system from benefiting simply because it skipped difficult cases.
The authors report two headline findings for their 2026 record through November 7. Within ECMWF and NOAA model pairs, the AI systems AIFS and AIGFS respectively show lower error than their physics counterparts across the displayed lead times. They also report that Darwin-Prediction-Weather has the lowest error for all four measured elements from one to seven days. These are claims from the project team's own live evaluation, not an independent certification. The site provides its forecast archive and score views so readers can inspect the underlying record.
Why daily evaluation is useful
A rolling leaderboard makes model behavior easier to examine beyond a single aggregate number. Users can look for seasonal drift, compare short- and longer-range forecasts, and see whether a global leader remains strong for a particular city or weather element. A model that is excellent for temperature may not lead on precipitation; one that wins on average may be inconsistent in the location that matters to a user.
The design also makes lead time visible. Forecast error generally rises as the target moves farther into the future, so a claim such as “best model” is incomplete without stating the horizon and variable. A practical evaluation should therefore start with a decision: which location, quantity, threshold, and lead time actually affect the intended use? Only then should a leaderboard ranking enter the discussion.
Consider an energy planner interested in unusually hot afternoons three days ahead. The relevant slice is maximum temperature at a three-day horizon, ideally in cities with comparable climate behavior. A seven-day global average or a precipitation score would not answer that question. Likewise, an event organizer worried about any rain may care more about threshold detection and false alarms than squared error in millimeters. RMSE is informative, but it is not a complete decision metric.
Boundaries behind the ranking
ERA5 is a widely used reanalysis product, but it is a gridded reconstruction rather than a direct station observation at every city. That distinction can matter for local extremes, terrain, coastlines, and urban heat. FINAL-Bench says station-based scoring is planned; until then, the ranking should be read as performance against the chosen reanalysis reference.
Coverage is another boundary. Twenty-four cities across six continents offer geographic variety, but they cannot represent every climate regime or high-impact weather situation. The common-case rule improves comparability while potentially excluding periods when a model is missing. RMSE also gives larger errors extra weight, which is useful when large misses are costly but can obscure calibration, bias, event frequency, and categorical skill.
There is also an ownership consideration: the team maintaining the benchmark created Darwin-Prediction-Weather. Open data and reproducible scoring help, but strong conclusions still benefit from independent replication. The source describes Darwin as a skill-weighted fusion of multiple global forecasts with local corrections for temperature and wind. That can be valuable operationally, yet it is not the same comparison as choosing between standalone numerical and AI forecasting systems. A fused product may inherit both the strengths and availability requirements of its inputs.
A checklist for responsible use
Before choosing a forecast from the top row, verify that the archive contains the expected initialization times, units, locations, and matching cases. Recalculate a small sample of scores if the decision is consequential. Examine results by month and city rather than relying only on the cumulative total, and compare RMSE with bias, absolute error, threshold skill, and reliability where those measures are available.
Finally, separate evaluation from deployment. A leaderboard can identify candidates, but production selection also depends on update latency, data licensing, geographic resolution, failure handling, and access continuity. FINAL-Bench's strongest contribution is therefore not merely naming a daily winner. It offers a public framework for asking narrower, testable questions about weather forecasts—and for revisiting the answers as new observations arrive.
Source: Which Weather Model Is Most Accurate? We Score Them Every Day, in the Open ↗. How we write